Trends from MLS Ozone Data
| Figure 1 shows the trend results calculated from the MLS measurements for the time period from the beginning of measurements on the Aura satellite through the end of 2020 as a function of latitude and altitude. See here for information on the MLS ozone data. We see a feature in the upper stratosphere that is similar to that calculated in the 2D model; maximum increase in the 1-3 hPa region primarily in the mid to high latitudes. The region of positive significant trends reaches further down from the upper stratosphere in the southern hemisphere and merges into a region of strong positive trend near the Antarctic polar vortes. In the tropics and northern midlatitudes there is a region of continued negative trend between about 10 hPa and 100 hPa although only a small strip of this is statistically significant. There is an oscillation of the trend in the tropical region between about 70 hPa and 200 hPa with the lowermost region showing apparent statistical significance. I wonder what this oscillation means about the MLS retrieval in this region and whether the significant positive trend is actually real. At the top of the stratosphere the positive trend goes to zero near 1 hPa and reverses to a thin layer of significant negative trend that extends from 50S to 50N at about 0.7 hPa. |
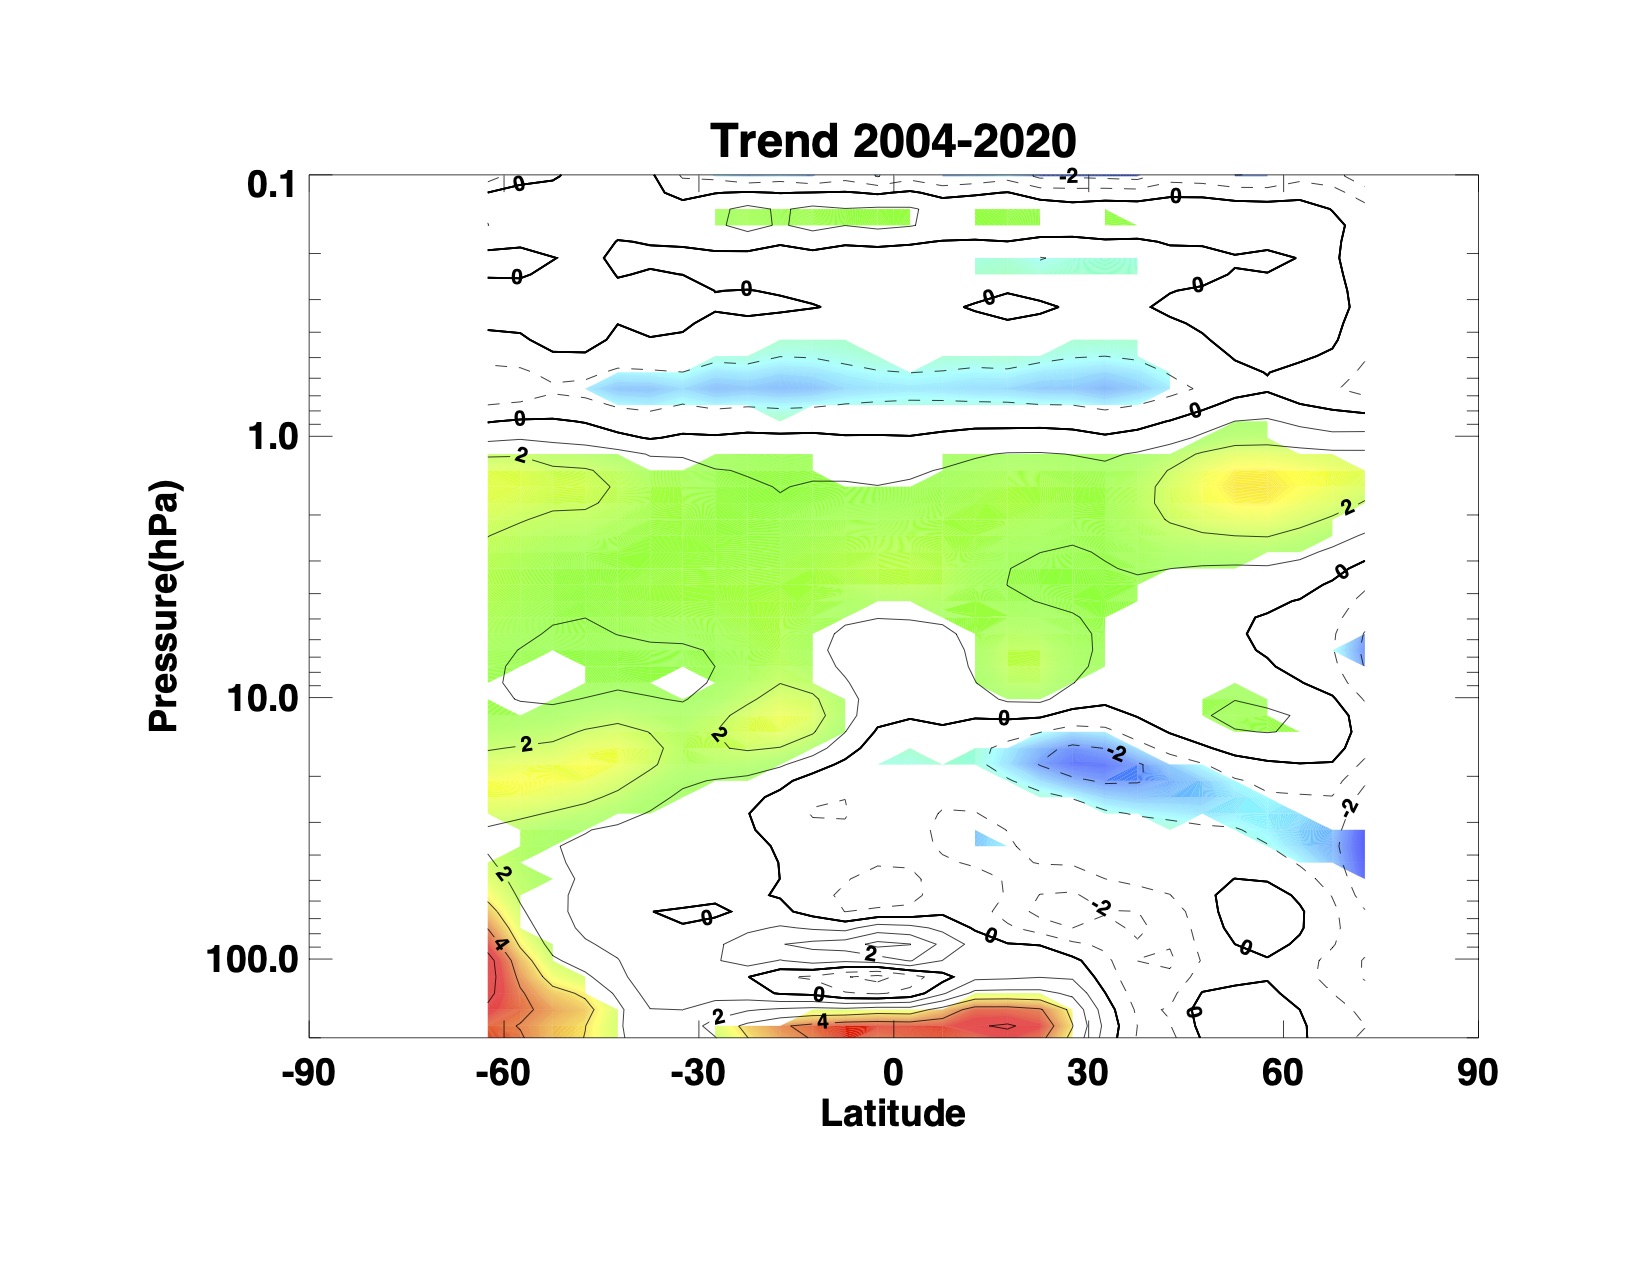 Figure 1: Trends in %/decade as a function of latitude and altitude computed from MLS ozone data for the time period from 2004 through the end of 2020. Colors indicate statistically significant trends at the 2σ level. White regions are not statistically significant. |
| Figures 2 and 3 show the calculated Quasi-Biennial Oscillation (QBO) derived from the MLS data. The proxy used for the QBO is the first two empirical orthogonal functions (EOFs) derived from the winds measured as a function of altitude over the tropical station at Singapore. |
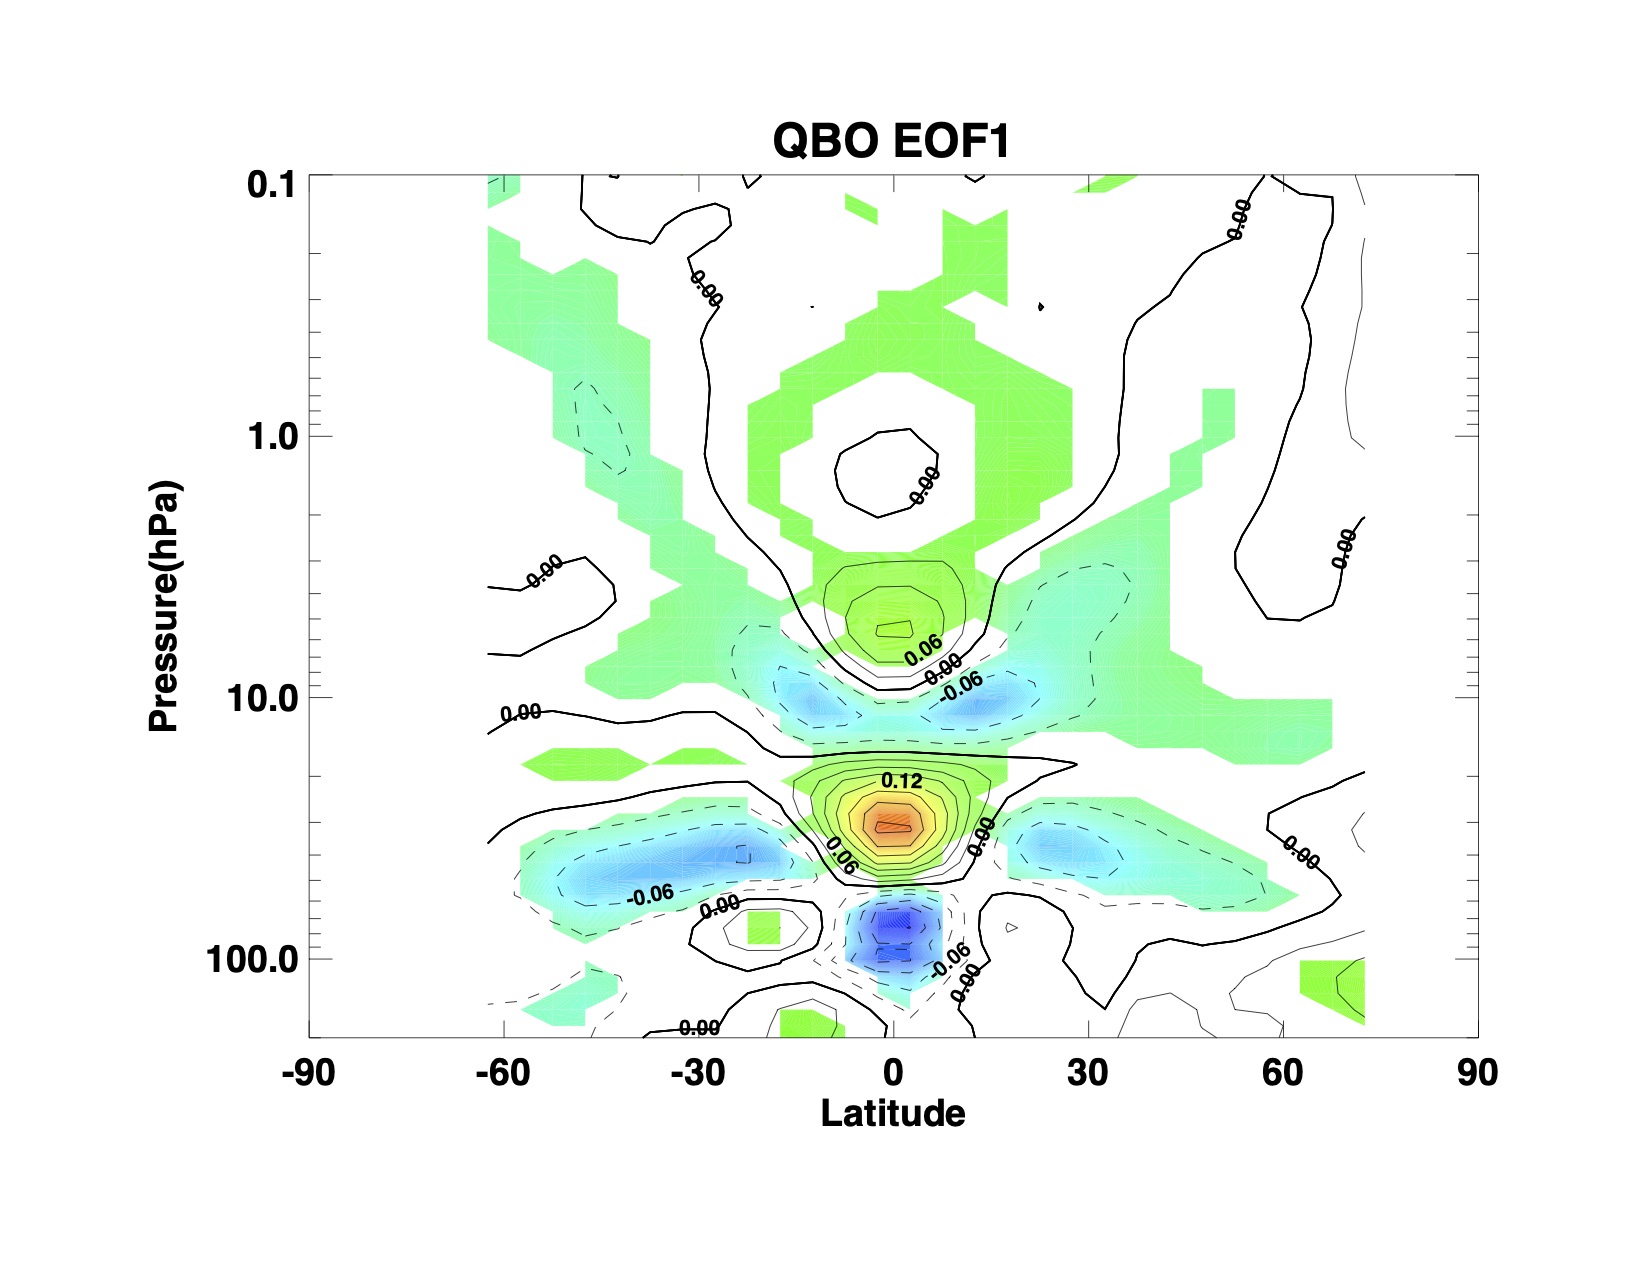 Figure 2: |
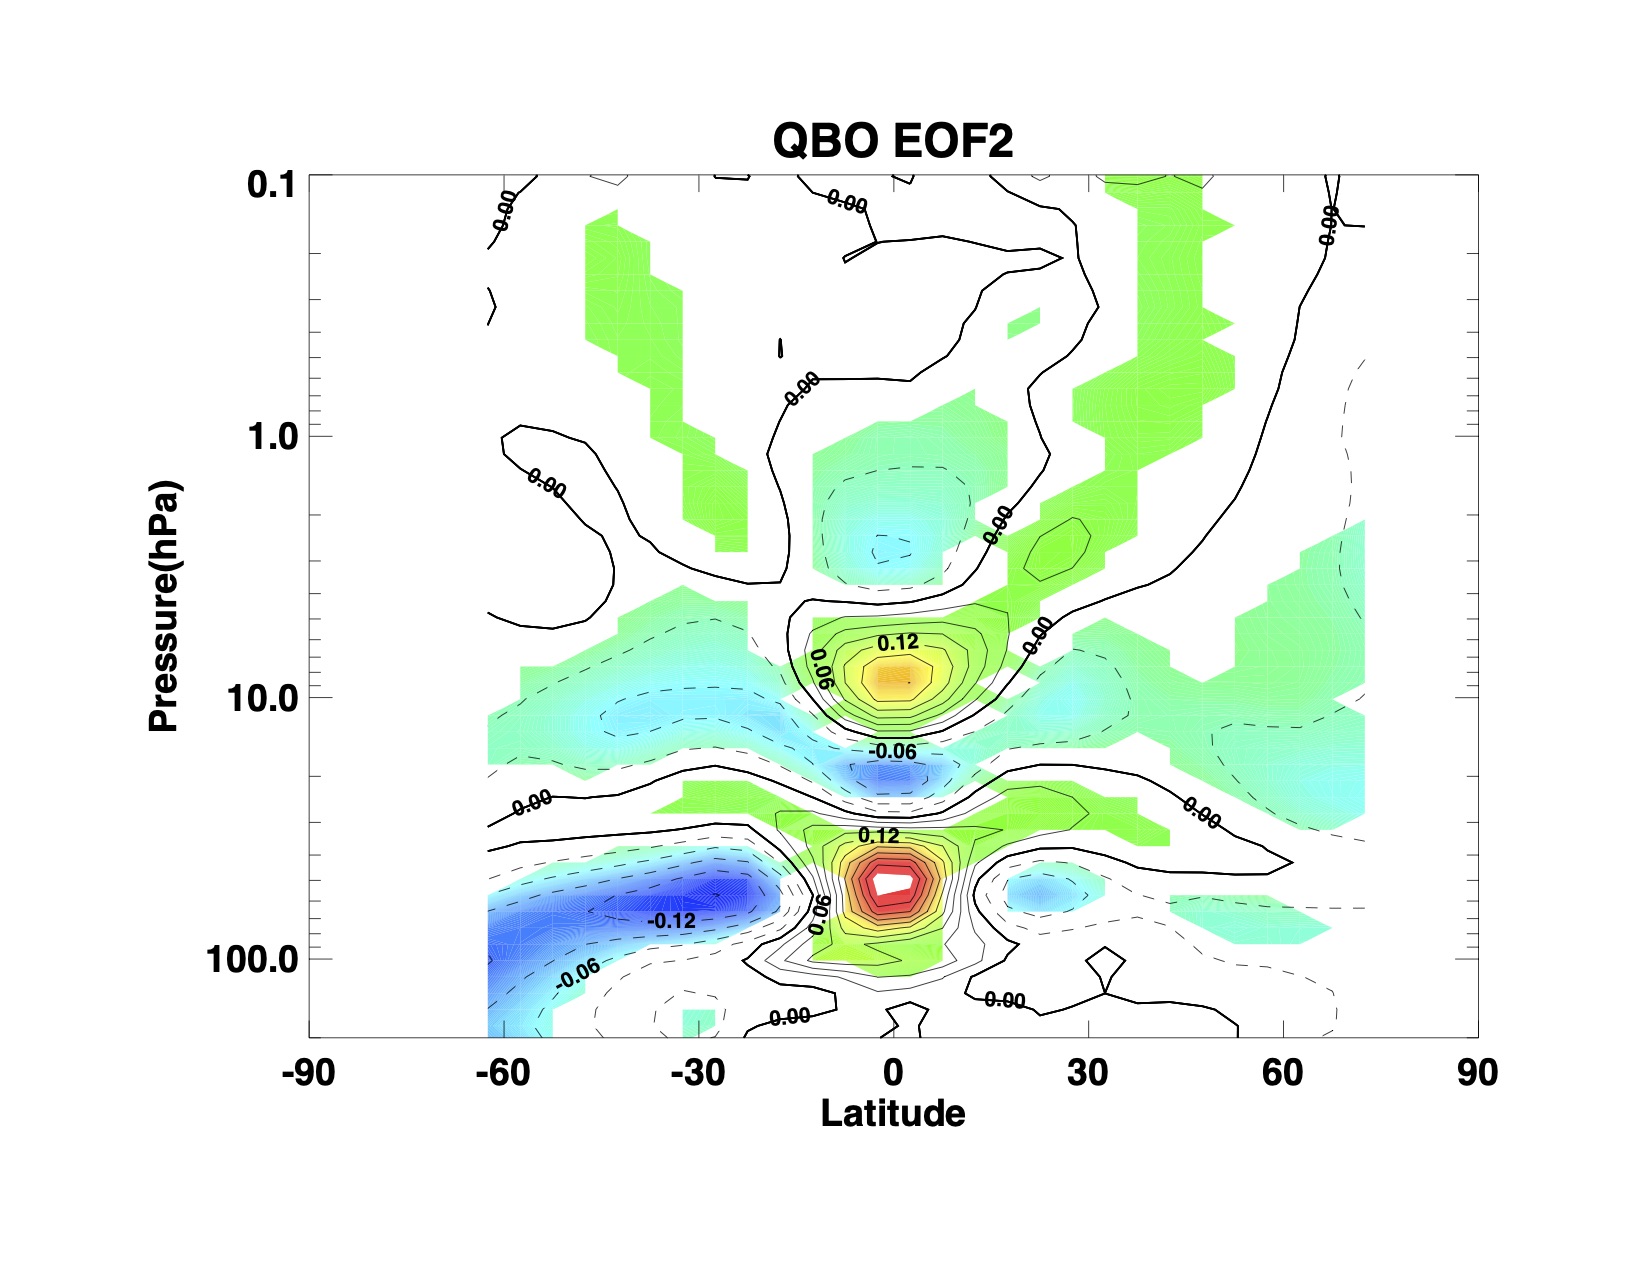 Figure 3: |