
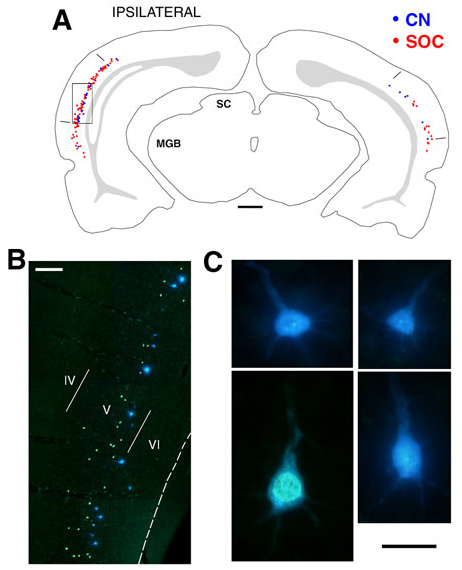
Fig. 6. Retrograde labeling in cortex of one animal that received an injection of FB into the CN and DiY into the SOC. (A) A drawing of a coronal section through temporal cortex showing the distribution of labeled cells. Cells labeled with FB are shown in blue and those filled with DiY are shown in red. The borders of Te1 are illustrated with solid lines. Ipsilateral refers to the side of the brain that received the injections. Notice that the cortical areas projecting to the CN and SOC overlap extensively, indicating that area Te1 (primary auditory cortex) targets both of these nuclei. The scale bar equals 1 mm. (B) A photomontage of the highlighted area in panel A, illustrating the laminar separation of cells projecting to the CN (blue, deep layer V) and to the SOC (yellow�green, middle and deep layer V). Scale bar equals 0.3 mm. (C) Photomicrographs of representative cells within Te1 labeled after injections of FB in the SOC. The double labeled neuron is from a different experiment where FB was injected into the CN and DiY into the SOC (lower left). Scale bar equals 25 µm.
From:
Doucet JR, Rose L, Ryugo DK (2002) The cellular origin of corticofugal projections to the superior olivary complex in the rat. Brain Research 925: 28-41.
[ Back ]