


|
|
||||
|
|
|
|
|
|
|
|
||||
 Making Waves
Just how does the wind transfer energy to waves? The problem — which impacts everything from weather forecasting to global warming — has perplexed scientists for years. Now, a team including Hopkins' Tihomir Hristov may finally have some answers. In August 2001, Tihomir Hristov was in a seemingly enviable position: watching the sun rise over the ocean off the coast of Hawaii. Out at sea, he was surrounded by warm ocean breezes, bright blue water, and the shimmering oranges and reds of the dawn. But he had other factors to consider that morning. Hristov, who would join Johns Hopkins four months later as an associate research scientist in Earth and Planetary Sciences, wasn't off the coast of Hawaii on a cruise ship. He was on a 108-meter-long ocean research platform, the non-propelled Floating Laboratory Instrument Platform or FLIP. He had come to work on a question that had been bothering scientists since at least the 19th century: How does the wind transfer energy to waves? FLIP has a range of unique features that have made it invaluable for ocean-based research for four decades, but that morning it was performing the most bizarre feat in its repertoire: shifting from a horizontal orientation to a vertical one. It's a bit like a baseball bat -- one longer than a football field -- going from floating horizontally on the surface of the water to a position where only the knob of the baseball bat is floating above the water and the rest of the bat points straight down below the surface. The Navy had created FLIP in the 1960s to study acoustics. The living quarters, laboratory space, and control room are all gathered at one end of the bat. When vertical, there are four stories of enclosed rooms and open decks outside the rooms. Hristov and two colleagues from the University of California-Irvine were aboard as the massive platform slowly swung from one position to another, almost like an amusement park ride for sober-minded scientists. "They can get you on and off the platform when it's vertical, but it takes some effort, so they only do that in emergencies," Hristov explains.
The researcher adds that having crew already aboard and
starting the flip procedure at dawn also helps ensure that
corrective measures can be taken if something goes wrong.
Not that those aboard would be asked to go "down with the
FLIP" in a drastic emergency -- they stood outside the
platform, lifejackets on, during the turnover in case they
needed to "leave immediately," as Hristov puts it. |
|
| More than two-thirds of the Earth's surface is covered by water, making the interface between wind and water an important channel for energy flow. |
The procedure took 40 minutes. One aspect of the transition
that stands out in Hristov's memory is the noise. "To change orientations, FLIP has tanks that it fills with water," recalls Hristov. "The air coming out of the tanks makes a loud noise like a locomotive's whistle." Hristov's postdoctoral mentor, Carl Friehe, professor of mechanical and aerospace engineering at the University of California-Irvine, had actually been through the process before, having spent some time doing research on FLIP off the coast of California in April 1995. "About halfway through, you have one foot on a wall, and another foot on what becomes the floor," Friehe recalls. "Then what was formerly the floor becomes the wall. The last part goes pretty quickly -- about 30 degrees in a few minutes, and then the whole platform oscillates for a few minutes like a fishing bob, and then becomes very stable." At the successful end of the rotation, Hristov, Friehe, and Scott Miller knew they wouldn't be getting off the platform again for a long while. They had shipped out on FLIP to study how wind creates waves, and had scheduled an entire month of time on the relatively confined space to acquire data for detailed analysis. Data from that session is still being analyzed, but earlier this year the three researchers published an analysis of the results from the 1995 California observing session (Hristov was unable to be aboard FLIP for that one). Led in part by a new analysis technique developed by Hristov, they just announced a significant advance. In the March issue of Nature, they compared theories of how the wind creates waves with data on the same process taken directly from field observations. It was the first new attempt in decades to make such a comparison. Hristov says that previous attempts to bring together models of atmosphere and ocean dynamics produced a clash. The ocean models suggested that the ocean pulled more energy from the atmosphere than atmospheric models suggested it could actually give. Understanding wind-to-wave interaction is important to a variety of practical applications, including forecasts of weather patterns and wave activity. But the 800-pound gorilla that no one can ignore in this patch of scientific territory is global climate change. Scientists who work to put together models to assess how much temperatures have risen and to predict how far they'll go up in the future need a detailed sense of how energy flows into and out of the atmosphere. More than two-thirds of the Earth's surface is covered by water, making the interface between wind and water an important channel for energy flow.
"The wind-wave dynamic has been kind of the missing link
between atmospheric modeling and ocean modeling," Friehe
says. "Present climate studies of ocean warming or ocean
cooling do not have an input for the wave field." |
|
"There have been a lot of brilliant theories written
over the years" about the wind/wave dynamic, notes Tihomir
Hristov. "However, what's been missing is experimental
verification." Photo by Chris Hartlove |
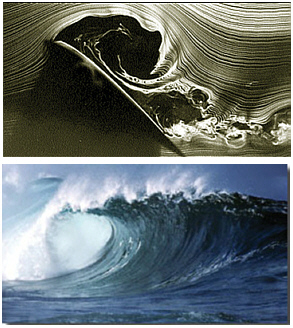
 Better understanding of wave creation is also important
because breaking waves mix carbon dioxide into the ocean,
making it a sink for a key compound linked to global
warming.
Better understanding of wave creation is also important
because breaking waves mix carbon dioxide into the ocean,
making it a sink for a key compound linked to global
warming. Unfortunately, the interaction between wind and water is an intricately complex one. (The American Heritage Dictionary of the English Language, under its entry for the word "dynamics," lists this sample sentence: "The dynamics of ocean waves are complex.") At the heart of the problem, Hristov says, is the transition from smooth flow to turbulent, chaotic flow. Science enthusiasts need nothing more complicated than the faucet in a sink to observe this puzzling process, Hristov points out. Turn on the faucet as low as possible, and the stream of water falls down to the drain in a razor-sharp straight line. That's non-turbulent or laminar flow. Gradually turn the water pressure higher, though, and a transition will occur. The stream of water develops complex irregular edges tumbling unpredictably through space. This is turbulent flow. "This transition to turbulence is often modeled as the development of instability," Hristov says. "A small disturbance will develop, grow in energy, and lead the transition from ordered or smooth motion into random, chaotic motion." A quiet, dark-haired Bulgarian, Hristov has a love of science that occasionally overwhelms his dedication to decorum. Otherwise very soft-spoken and reticent, he loves getting to the crux of a description of a scientific problem or study, often prefacing this critical part of the story with the words, "The interesting thing is ..." Hristov originally studied turbulent flows in astrophysical contexts at the University of Sofia. When he began postdoctoral study at the University of California-Irvine and met Friehe, he became interested in turbulence on the surface of the ocean, which he calls "suprisingly not that different" from turbulence problems in astrophysics. Friehe says of Hristov, "He's a first-rate theorist and applied mathematician [who is] very careful and thorough about processing and interpretation of data." Friehe was taught by a Hopkins alum at Stanford, William Schwarz, who later returned to Hopkins; Friehe accompanied Schwarz to Hopkins for a time, as a postdoctoral fellow. Friehe has long been interested in wave dynamics and was the first to realize what a boon FLIP could be to scientists wishing to analyze wave creation. Before FLIP, any oceanographer wishing to study the creation of waves on the ocean had to deal with a completely uncontrollable and frequently changing mixture of factors like wind speed and direction, and wave height and speed -- as well as the noise induced into their measurements by the incessant bobbing and tossing on the waves of the ship from which they took those measurements. FLIP, though, was designed specifically not to bob. In its vertical position, the baseball bat that is FLIP has the narrowest part of its neck -- just below the "knob" of the bat -- at the waterline, and that makes it very stable. FLIP's Web site notes with obvious pride that the platform, rated for 30-foot waves, has actually survived "80-foot blue water swells." "The point is to be able to take measurements as if you were standing on the end of a pier," Friehe says. "But you don't want to be limited to just being at the end of a pier over shallow water, you want to be able to make measurements as though from a fixed coordinate anywhere on the ocean." Hristov remembers that FLIP's design adaptations for vertical and horizontal use made being aboard a bit like living in a painting by M.C. Escher, the Dutch artist famed for incorporating unnatural, unusual, and even impossible perspectives into his drawings. "You can see staircases going into the wall or the ceiling, or a door on the ceiling, which had been a wall when the platform was horizontal," Hristov recalls with amusement. "And the sinks and the beds all have two positions -- horizontal and vertical."
Hristov admits that he was a little worried at first about
keeping occupied for a month on the small space of the
platform. There were a few brief opportunities to view
sealife, usually at night. Occasionally someone would go
fishing. A cache of videotape movies donated by prior FLIP
users came in handy, but most of the time Hristov found his
research responsibilities kept him quite busy enough to
make the time fly. |
| Previous attempts to bring together models of atmosphere and ocean dynamics produced a clash. The models suggested that the ocean pulled more energy from the atmosphere than atmospheric models suggested it could actually give. |
In his binder full of images, charts, and data related to
his oceanographic research, Hristov has set aside the front
page for a quote he uses to help explain why he and his
colleagues went out on FLIP. The quote, attributed to
Nobel-winning English chemist Sir Cyril Hinshelwood,
asserts that researchers who study fluid dynamics, or the
flow of liquids and gases, are "... divided into hydraulic
engineers who observed things that could not be explained
and mathematicians who explained things that could not be
observed." Hinshelwood's remark, an equal-opportunity poke at both sides of a difference of perspectives, seems designed more for amusement than for bite. Hristov seizes it as a clever way to summarize an important gap that he feels has existed for decades between experimental data about how wind interacts with waves (the hydraulic engineer's perspective) and theory on the same topic (the mathematician's perspective). No classical scholar has ever been acknowledged as the first to notice that the drag of air on the surface of water creates waves. Drag causes differences in air pressure, producing ripples on the surface of the water that wind can push on and grow into waves. As a wave grows in height and size, the wind still pushes on it, but the patterns of interaction grow increasingly turbulent and chaotic, like the faucet passing an increasing flow of water. One of the first prominent modern scientists to consider the problem was 19th-century British physicist William Thomson, more commonly known as Lord Kelvin. "In an 1871 theoretical paper, he found that 6 meters per second is the minimum windspeed at which waves are generated," Hristov explains. "This is not currently confirmed by experimental data." Kelvin, whose research in a variety of subdisciplines of physics won him considerable fame, actually was paid a handsome sum to come to Johns Hopkins in 1884 to deliver a series of scientific lectures, according to Peter Achinstein, Johns Hopkins professor of philosophy. Achinstein is a scholar in what he refers to as the "philosophies of scientific evidence," a pertinent perspective for any story of a theoretical-experimental gap. Through the Hopkins Center for the History and Philosophy of Science, Achinstein recently organized at the Homewood campus a first-of-its-kind conference on scientific evidence (see Wholly Hopkins). "The concern isn't so much how scientists got the ideas for hypotheses, but how they decide what will be the most convincing evidence they can use on skeptics," says Achinstein, author of a volume on the topic, The Book of Evidence. "Fundamentally, it's a problem of, Why should other people believe what I'm saying?"
Scientists' insights regularly reach beyond their ability
to establish new ideas directly through experimentation,
Achinstein points out, and that can make the question of
proof a particularly tricky one. He cites Sir Isaac Newton,
one of history's most famous scientists, as an example.
Newton's groundbreaking description of gravity in 1687
asserted that it was a force exerted by every mass on every
other mass throughout the universe. |
|
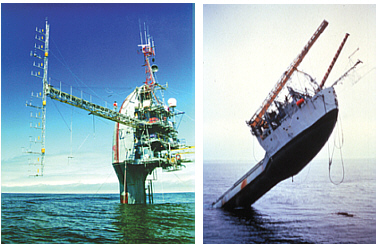
Scientists are aboard for the ride when the Floating
Laboratory Instrument Platform changes from its horizontal
orientation to its vertical orientation (left). At right,
FLIP is halfway through the transition. Both photos courtesy Scripps Institution of Oceanography |
 The provocative idea was impossible to directly test or verify, so Newton established four rules that emphasized the scientist's role as someone who draws reasoned conclusions from observations of natural phenomena. If a theory could be inferred from the observed phenomena using Newton's rules, then the theory was acceptable science. In the 19th century, some scientists began to assert that basing all theories on observable phenomena in the manner suggested by Newton was too constrictive and didn't allow enough room for imagination and novelty. English scientist William Whewell was one of the most important proponents of the new method, according to Achinstein. "Whewell argued that a hypothesis has to give you back more than what you already knew," Achinstein explains. "He said it had to give you predictions that you could test, and this became known as the hypothetico-deductive model. You start with a hypothesis, you use formal mathematics to deduce the consequences of the hypothesis, and then you go out and test to see if its predictions are true or not." Whewell asserted that the best test of a theory created via this route was its ability to account for new observations as science's abilities expanded and improved over time. "In Whewell's view, as more and more observations were acquired over time, the theory should become simpler and more coherent, neater rather than more complex," Achinstein says. "Further observations should only bring out the beauty of the theory." Hristov and his colleagues assert that because of the complexity of getting experimental field evidence, wind-to-wave theory had stopped this process of interfacing with observational data acquired on the ocean. "I don't mean to imply that the theoretical work has been lacking," Hristov politely points out. "There have been a lot of brilliant theories written over the years. However, what's been missing is its experimental verification. There hasn't been any experimental validation of all these remarkable theories, and you need that." After Kelvin, some of the most significant theoretical contributions came in 1957 from oceanographers Owen M. Phillips of Johns Hopkins and John W. Miles of the University of San Diego. Spurred by a 1956 review that called scientists' understanding of wave dynamics "profoundly unsatisfactory," Miles and Phillips, working independently, both came out with important new theoretical models in 1957, with Phillips' work focused on the creation of waves and Miles' work concerned with their growth. Miles was recovering from surgery at press time and unavailable for comment. Phillips, who retired five years ago as the emeritus Decker Professor of Science and Engineering in the Krieger School of Arts and Sciences, agreed on short notice to take a quick look at the new Nature paper. He praised the work that Hristov, Friehe, and Miller had done, but noted that theoreticians had never imagined it would be possible to verify their work experimentally with field data. As evidence of the need for experimental verification, Hristov cites a proliferation of theoretical work on wave creation since the 1970s. Taking advantage of the new availability of computer power, several researchers have tried to take increasingly complex looks at the processes involved in wave creation, with many building on the models proposed by Miles and Phillips, but with some new models also being proposed. The implication left unspoken by Hristov is that a proliferation of theoretical work implies a need to narrow the field by checking some of the theories against experimental data. Hristov also notes that attempts to study the energy transfer process in laboratory models have met with limited success. "There's a parameter that's involved in the calculations for studying this transfer, the Reynolds number, that is different over the ocean than it is in the laboratory simulations," he explains.
"To be confident that we understand a particular physical
phenomenon, we need to have a theory that explains it, and
we need a numerical model that can deal with the complexity
of that phenomenon," Hristov says. "Finally, there is need
for experiment to validate the model and the theory. And
the experiment has been lagging for all these years." |
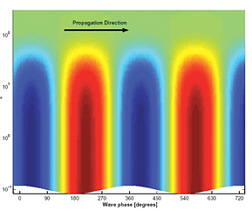
| Progressively darker shades of blue indicate regions of lower pressure, red shades show higher pressures. The relationship between these pressure structures to wave crests is revealed in the white silhouettes at the bottom of the graph. |
 For their Hawaii stint on FLIP, which took a year and a
half to plan, Hristov, Friehe, and Miller deployed several
wind instruments on a boom extending out from the platform.
This let them avoid any airflow distortions created by the
main platform. They simultaneously measured wave height
underneath the mast. They custom-designed software that let
them continuously record data day and night.
For their Hawaii stint on FLIP, which took a year and a
half to plan, Hristov, Friehe, and Miller deployed several
wind instruments on a boom extending out from the platform.
This let them avoid any airflow distortions created by the
main platform. They simultaneously measured wave height
underneath the mast. They custom-designed software that let
them continuously record data day and night.They had hoped for a chance to get data during a storm, Hristov says, but instead nature supplied them with 30 days of mild, vacation-friendly weather. Hristov remembers waking up on September 11, 2001, to the shocking news from New York City. FLIP has no propulsive motors of its own, and is towed out on research missions by other ships. The terrorist attacks shut down the harbor in Hawaii, leaving the scientists aboard concerned that FLIP might run out of the fuel it needed to be turned back to its horizontal orientation and towed to port. But their pickup came on time, leaving plenty of fuel for turning the platform back over. After the Hawaiian trip on FLIP, Hristov went back to work on analyzing data from the California observing session in 1995. He applied a technique he first developed in 1998 for separating the signals from random air motion, or turbulence, and the air motion that contributed to the growth of waves. As the lengthy analysis of the 1995 data neared its end, researchers were pleased to see a set of familiar interactions emerging. "The patterns we saw in the data were very consistent with the theory originally proposed in 1957 by John Miles," Hristov says. "And they maintained that consistency very well over a five-day observing period." Miles' model includes a concept known as the critical layer. Study a vertical column of air over the sea, and the air's drag on the surface of the water should make the wind speed over the ocean get slower as measurements are taken closer and closer to the ocean's surface. Move further up the column and away from the surface, and wind speed increases. At a certain point in the column of air above the ocean, known as the critical layer, wind speed will match the wave speed. Like several other scholars of fluid dynamics before him, Miles had used the critical layer as an important determining factor in his model of air-to-ocean energy transfer. Smiling with uncharacteristic openness, Hristov remembers a presentation by Miles at a seminar in honor of Phillips' retirement in 1998. At the seminar, someone in the audience had asked Miles about the critical layer, and Miles responded that it was a "mathematical convenience."
Scientists knew that the critical layer would exist, and
the March Nature paper showed that. But it showed
something more -- that the critical layer is key to
understanding the dynamics of wind-wave energy transfer,
just as Miles' model predicted it would be. Hristov is
clearly tickled by the finding -- not out of any desire to
correct Miles' assertion, but because Miles' remark shows
how highly skeptical scientists once were that the critical
layer would ever be directly observed in data. It's as if
the experimentalists had helped the theorists deliver a
particularly stubborn baby many years after the theorists
had given up on ever seeing their child emerge into the
real world. |
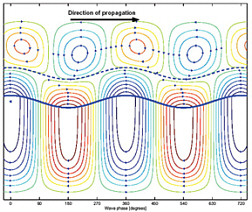
| A diagram from Hristov's research details the intricacy of wind-wave interactions. The thick blue line is the surface of the water; the circles with arrows show patterns of flow in the air and the water. The dotted line is the critical level that scientists have shown is essential to understanding wind-wave interaction. |
 Hristov came back from a European science conference in
mid-April surprised by the high level of responses that he
received to the March Nature paper -- "not all of
them positive," he adds with an embarrassed grin. He noted
with pride, though, that he'd offered all his detractors a
chance to point out where he went demonstrably astray in
the paper, and none had been able to do so.
Hristov came back from a European science conference in
mid-April surprised by the high level of responses that he
received to the March Nature paper -- "not all of
them positive," he adds with an embarrassed grin. He noted
with pride, though, that he'd offered all his detractors a
chance to point out where he went demonstrably astray in
the paper, and none had been able to do so.Friehe said the Nature paper has led to a number of proposals for follow-up studies that he's currently putting together with colleagues in California, including studies of breaking waves from a low-flying plane. In April, Hristov showed a visitor a customized instrument that he had built. The heart of the device is a transparent, air-filled cylinder sealed in a foam, foil-covered box. The air in the cylinder provides a reference to pressure that allows the instruments to detect extremely small changes in air pressure. "Typical atmospheric pressures are on the order of 100,000 pascals, but these instruments can sense changes of 1 pascal," he explains with pride. Hristov plans to use the new instruments to study pressure differentials over waves, another way of assessing the energy exchange between wind and waves. Wind's drag on the surface of the water causes a very slight increase in the air pressure behind the wave and lowers pressure in front of it. At the end of April, Hristov rode a ship out to a Woods Hole Oceanographic Institution research tower, the Air-Sea Interaction Tower, off the coast of Martha's Vineyard. Hristov's instruments will stay there for five months. Unlike his time on FLIP, he won't be seeing many sunrises or crashing waves. "I'll be checking in on the instruments from time to time, visiting regularly, and hoping all goes well," he says. "But no, I'm not staying out there with them." Science writer Michael Purdy is based in Baltimore. |
|
|
|
 The Johns Hopkins Magazine | The Johns Hopkins University |
3003 North Charles Street |
The Johns Hopkins Magazine | The Johns Hopkins University |
3003 North Charles Street | Suite 100 | Baltimore, Maryland 21218 | Phone 410.516.7645 | Fax 410.516.5251 |
|
