Black holes are the most mysterious objects in the cosmos, but the gravitational “musical notes” that they produce when they form from the merger of other black holes are very well known. Most of us can recognize a variety of instruments by their sound. The same technique – which consists in identifying certain “notes,” and which in the context of atomic physics is called “spectroscopy” – is used to identify chemical elements, but also to study our Sun and other stars. “Black hole spectroscopy” has attracted considerable attention with our new ability to observe gravitational waves. These waves carry the pure tones of black holes: they can tell us about their properties, and perhaps even show that black holes are not what we think they should be.
In the absence of noise, we can use gravitational waves to “hear the shape of black holes” - just like we can, at least in in principle, use sounds to hear the shape of a drum. But what if we try to pick up these sounds in the noise of our detectors?
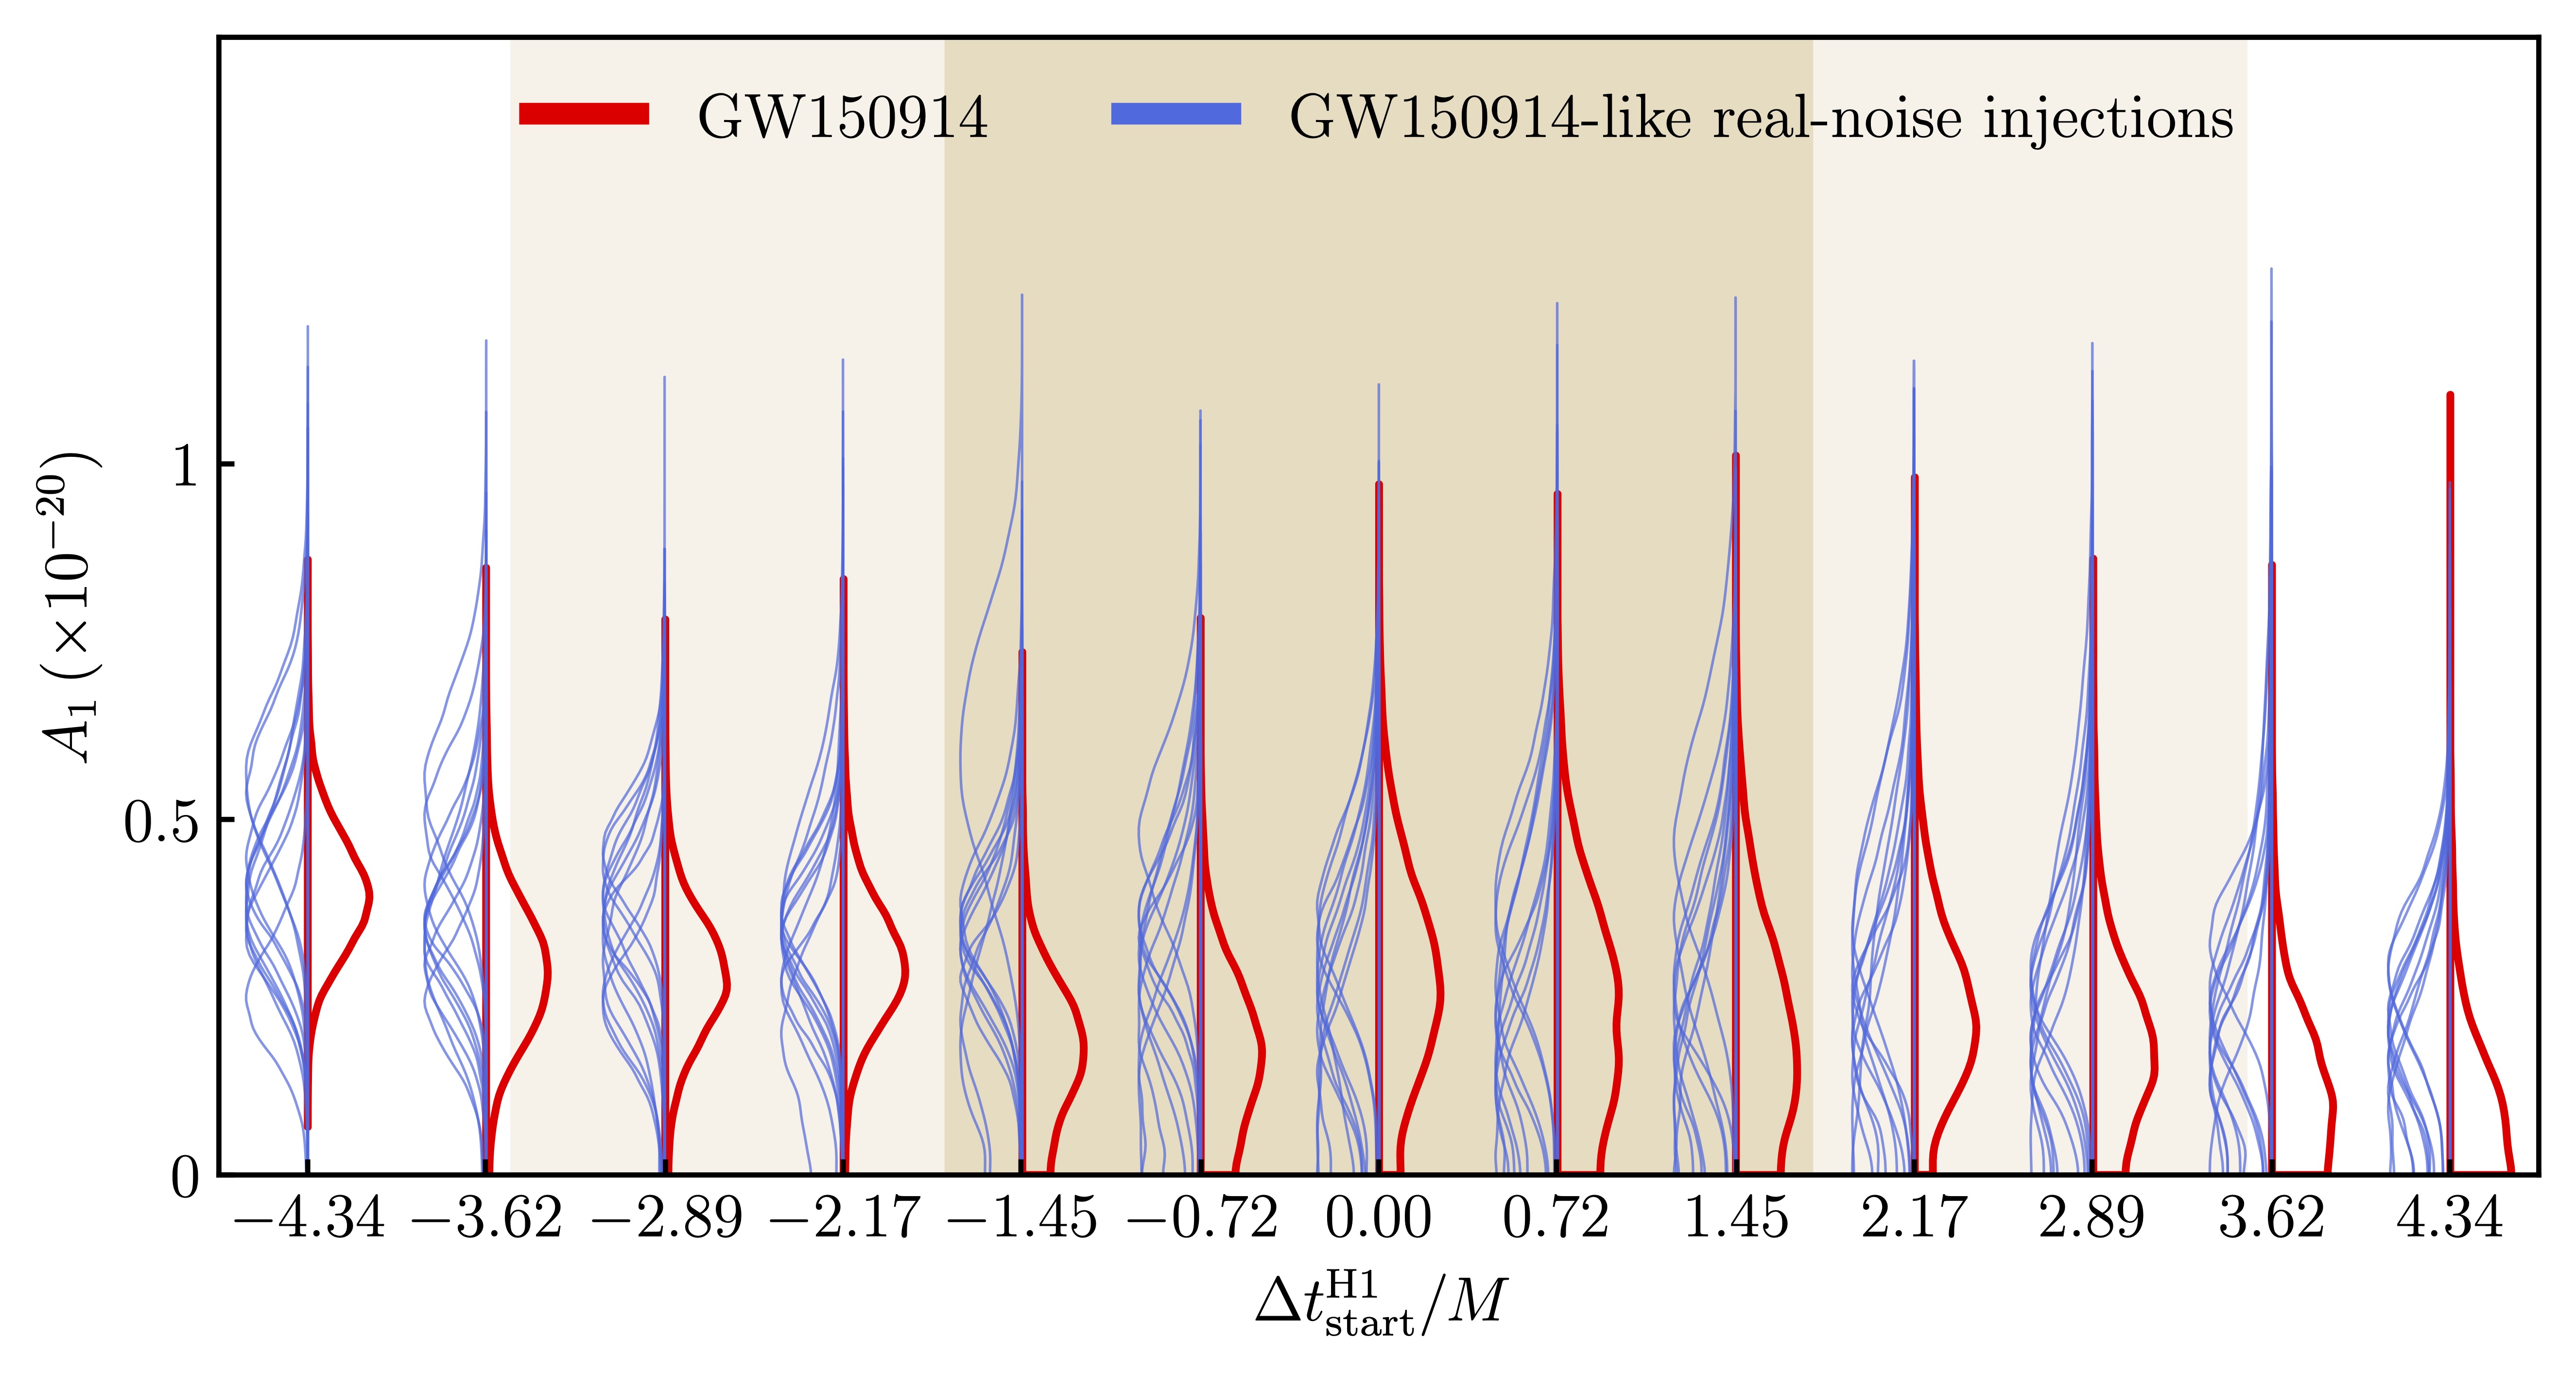
In this work, selected by Physical Review Letters as an Editors’ Suggestion and highlighted as a Synopsis in Physics, we show that robustly extracting characteristic sounds of black holes in the presence of noise presents previously unforeseen complications, and that more advanced gravitational-wave detectors and data analysis techniques are required to do black hole spectroscopy. Extreme care needs to be exercised when interpreting observations with current instruments, because the time at which a black hole forms is poorly known, and because detector noise can strongly affect our interpretation of which characteristic black holes sounds we are “hearing” in the data. Previous claims that we have seen two “tones” in the first gravitational-wave event should be interpreted with great care. While we may get lucky in the next LIGO/Virgo/KAGRA runs, black hole spectroscopy will only become precision science with the advent of next-generation detectors on the ground and in space.